There’s something I’ve been puzzling about for a long time. So I finally decided to check it out and share the results with you. I wanted to know the relationship between the camera’s built-in light meter and the histogram. OK, sounds geeky so what exactly am I talking about and why do I care?
If you read up on light meters you know that they measure the brightness of the scene and set the exposure so the average is neutral gray. OK fine, but what is that? Neutral gray is a pure gray that doesn’t appear light or dark but is right in between. That’s been determined to be a gray that reflects 18% of the light that falls on it,. Or put another way, it absorbs 82% of the light that falls on it. By comparison, a white surface reflects nearly 100% while a black surface reflects nearly 0%. So 18% is right between light gray and dark gray.
And that’s what your camera’s light meter tries to do with the scene your shooting – make the average brightness neutral gray. Those areas that are brighter than the average will appear brighter and those that are darker will appear, well, darker.
So, I understand that. But the burning question is, “What does the camera’s histogram show?” Remember, a histogram shows the amount of each shade of gray in your image from maximum black to maximum white. Maximum black is on the left end of the scale and maximum white is all the way to the right. All possible shades of gray from black to white are distributed along the histogram from left to right.
So another way to put the burning question is, “Where does neutral gray show up on the histogram?” Since it’s ‘neutral’ gray, that is, neither light or dark, does it show up in the middle? Or, because it’s 18% reflectance, does it show up to the left of center, toward the dark end?
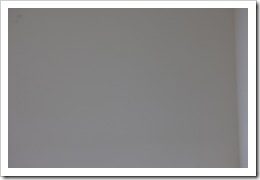
To determine this I needed to take a photograph that was uniform color and uniform luminosity. Well, a wall works pretty well. So I found a wall in our house that was uniformly illuminated and photographed it. Pretty exciting. It recalls memories of watching grass grow and paint dry. But for the purpose at hand it is perfect. It produces a very narrow histogram, pretty much a spike, which is exactly what we need.
|
|
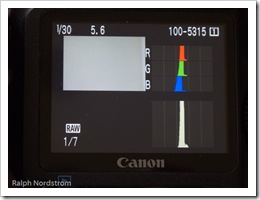
Here’s the picture and next to it is the histogram as displayed on my Canon 1Ds Mark III. If you look at the histogram you see that it’s pretty narrow, just like we want it, and slightly to the left of center. The histogram scale is divided into five zones and this histogram falls near the middle of the third zone. That’s good to know. Also, the three colors of the RGB histogram done quite line up, indicating the paint has a slight warm hue.
But as is so often the case in life, the answer to one burning question raises another. This one has to do with exposure compensation. If I overexpose one stop, how far to the right will the histogram move? Let’s check it out.
 |
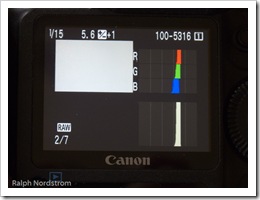 |
This image was exposed at +1 EV, or, overexposed by one stop. And, as expected, this histogram moved to the right. Now it’s in the fourth zone. It moved about one zone to the right.
What about a two stop overexposure? How will that affect the histogram?
 |
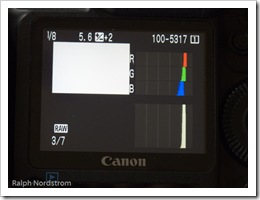 |
At +2 EV the histogram moved further to the right but not a whole zone. Now it’s straddling the fourth and fifth zones.
Let’s go for three stops of overexposure.
 |
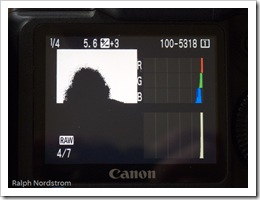 |
This histogram made it all the way to the right wall and the highlight clipping warning was triggered (that’s the black part of the image where the clipped area is flashing).
Let’s go the other way. Let’s see what happens when we underexpose by one stop.
 |
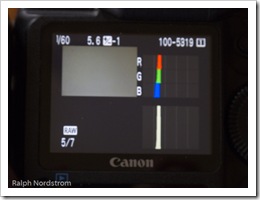 |
At -1 EV the histogram moves from the middle zone down to zone two.
 |
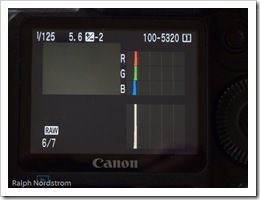 |
At –2 EV the histogram now is on the line that divides zone one and two.
 |
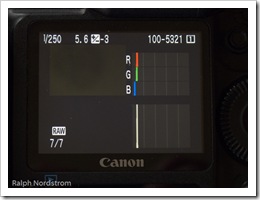 |
Finally, at –3 EV the histogram is close to the left wall but not quite there.
So we can see that adjusting the exposure up or down by one stop moves the histogram about 2/3 of a zone. (Now, I’m talking Canon speak here when I say 2/3 of a zone because the Canon histogram is divided into five zones; other camera manufacturers divide their histograms differently .) Another way to think if this is that each of the five zones represents 20% of the total histogram range. So adjusting up or down one stop will move the histogram about 2/3 of that distance or 14%.
What’s the value of knowing all of this? In landscape photography we frequently find ourselves in positions where the light meter is fooled and we need to overexpose or underexpose the image to get the ‘correct’ exposure; i.e., exposure compensation. That’s such an important function that most prosumer digital SLRs make this really easy to do. But often you end up guessing, taking the shot, checking the histogram and deciding you didn’t compensate enough or you compensated too much. With this knowledge it is possible to make more informed guesses as to how much compensation you need to dial in. For example, if I needed to move the histogram to the left one zone (about 20%) I’d dial in -1 1/3 stops of exposure compensation.
Another useful piece of information is that highlight clipping kicks in when an area is three stops overexposed. This is useful if you’re spot metering a scene and want to know how much to overexpose the clouds or the snow to get it to turn out white. You don’t want to go over 3 stops so you may choose 2 1/3 just to be safe. (Hey, maybe I should do a post on spot metering.)
Another useful piece of information related to this is that there is a practical dynamic range of about 6 stops. At +3 stops you get highlight clipping and at –3 stops you’re in such a dark area of the of the sensor’s dynamic range that you could be getting into trouble as far as noise goes. I should mention that in Lightroom you can often eek out another stop on either end with the Recovery and Fill Light adjustments.
I must hasten to add that these results are for a Canon 1Ds Mark III. The results on your camera may be different. When it takes 1 1/3 EV adjustment to move the histogram 20% one way or the other, on other cameras it may be just 1 EV. So I encourage you to find a blank wall and check this for yourself.
Hopefully this little journey into the geeky side of exposure sheds some light on a couple of things; namely, how the camera’s light meter works and how that gets represented on the histogram. Exposure is one of the most critical components in creating great photographs and hopefully this will help you nail those exposures.
To see more of my photographs click here.
Join me on an upcoming workshop.
(1442)
I’m not sure you actually answered the original question: will a “neutral gray” wall show up at the 18% mark in the histogram, or in the middle?
Keith,
I think maybe I wasn’t clear enough. It doesn’t matter if the wall is neutral gray or not. It can be pure black or pure white. But the light meter will expose it so that it has an 18% reflectance. And, to your question, the histogram will be positioned right in the center. Thanks for the comment Keith. How’s the family? Give them my best regardds.
Very cool experiment. Good read!
Thanks Alexander. It’s a question I’ve had for some time so I thought I’d finally settle it and share what I found. I was a bit surprised.